In this study, CFD analyses have revealed vortices’ performance behind deflectors and assessed how they affect indoor wind-driven ventilation. The ventilation was based on the wind current in a boundary layer near the vents, which would lead to pressure drop and vacuum in them.
Impact of deflectors on ventilation
In this structure, deflectors play a crucial role in natural ventilation. They can provide air circulation due to the induced pressure gradient between the interior and exterior of the building. Thus, to understand the necessity of deflectors, the model’s total pressure distribution is presented in Fig. 10. As depicted in Fig. 10, the circulation on the leeward of the deflectors provides a negative pressure gradient (the outdoor pressure is higher than indoor vents). The pressure gradient and air velocity through the vents in four scenarios have been shown in Fig. 11. This led to suction forces that ventilated the indoor air through corridor vents as well as WV4 and EV2.
Figure 10
Pressure distribution around and inside the windmill.
Figure 11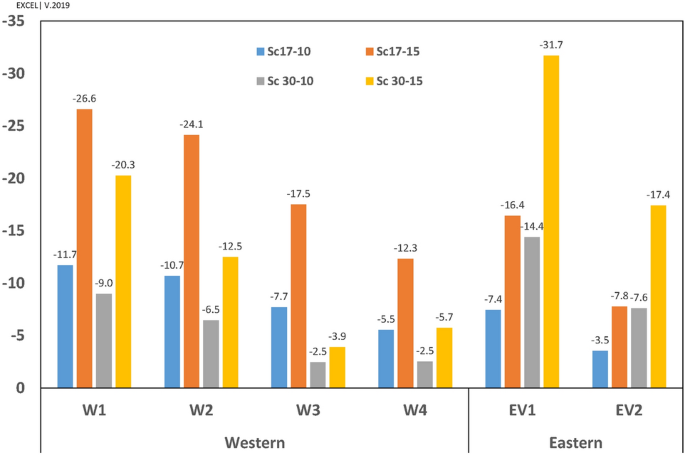
Pressure gradient in four scenarios for western and eastern vents.
Flow pattern
Flow patterns around the windmill have been depicted in Fig. 12. The ventilation by western and eastern vents was directly related to the vortices formed behind the deflectors (Figs. 12, 13, 14). In general, when the wind direction was (omega =beta =17^circ ) (perpendicular to frontier wall with the angles of attack being ({gamma }_{1}=55^circ ) and ({gamma }_{2}=29^circ )), i.e., Sc17-10 and Sc17-15, the length of vortex behind western deflector was larger than behind the eastern one and vice versa, increasing the flow angle to (omega =30^circ ), i.e., Sc30-10 and Sc30-15 resulted in higher vortex length behind the eastern deflector.
Figure 12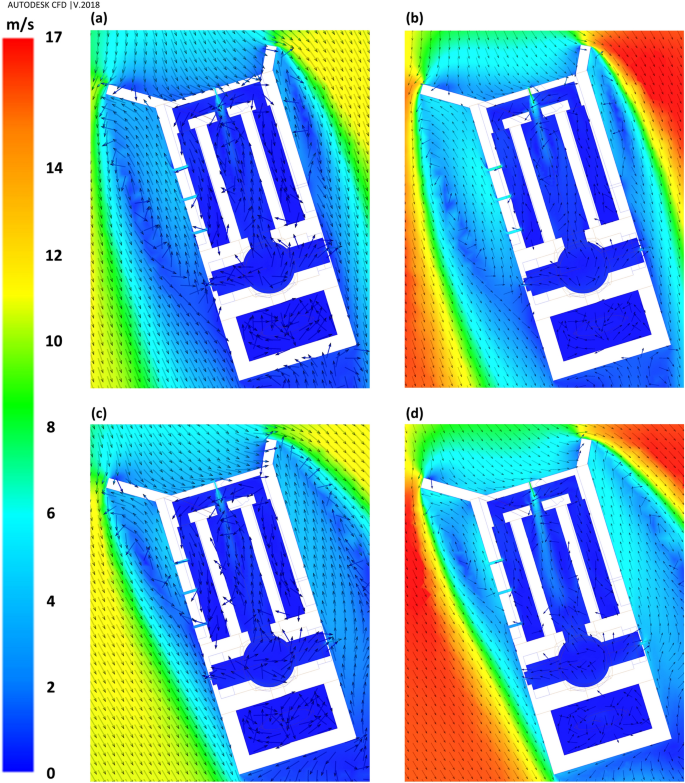
Flow pattern around the building in different scenarios: (a) Sc17-10, (b) Sc17-15, (c) Sc30-10, and (d) Sc30-15.
Figure 13
({V}_{y{^{prime}}}) on the profiles parallel and near the (a) western and (b) eastern wall, behind the deflectors.
Figure 14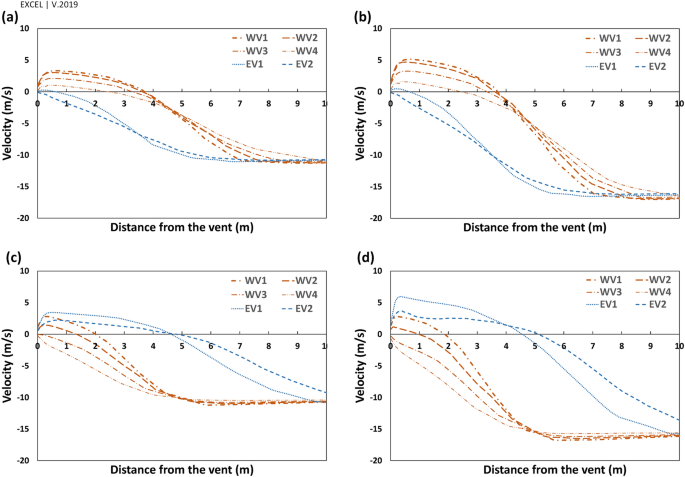
({mathrm{V}}_{mathrm{y{^{prime}}}}) on the perpendicular profiles to western and eastern vents in scenarios (a) Sc17-10, (b) Sc17-15, (c) Sc30-10 and (d) Sc30-15.
The parallel component of flow to the walls, ({V}_{y{^{prime}}}), would be an appropriate estimation for the shape of currents around the windmill. The positive values, ({V}_{y{^{prime}}}>0), showed reverse flow, while the negative values illustrated current in the same direction as the dominant wind in the space (ordinary current). Thus, the wind speed (({V}_{y{^{prime}}})) profiles were considered to assess the vortices’ length and width.
The vortices’ length has been assessed by two 25-m profiles from deflectors near the eastern and western walls (Fig. 13).
Furthermore, the vortices’ widths were measured by six profiles, ten meters away from the vents (Fig. 14). These graphs also demonstrated how the wind angles and speeds affected the vortices behind deflectors.
At (omega =17^circ ), the length of vortices was approximately 16.5 m and 8.5 m on the western and eastern wall, respectively, for both wind speeds, i.e., 10 and 15 m/s. Somehow, at (omega =30^circ ,) the length of vortices was 7 m and 9 m for the wind speed of 10 and 15 m/s, respectively, on the western wall. This value occurred at more than 25 m behind the eastern deflector (higher than the structure length) at both wind speeds.
In general, the widths of vortices were more expansive on the western wall when the wind angle was (omega =17^circ ), while it was wider behind the eastern deflector at (omega =30^circ ) (Fig. 14). In these profiles, on the vortices, the maximum ({V}_{y{^{prime}}}) occurred approximately 50 cm away from the walls and then diminished upon increasing the distances from vents. At (omega =17^circ ), the flow currents were directed to a normal flow pattern at near 9 m on the western and 6.5 m on the eastern wall (Fig. 14). On the other hand, at (omega =30^circ ), they tended to normal flow pattern at 5 m and more than 10 m for western and eastern walls, respectively.
In addition, the CFD results on sections A-A revealed that RV1 and RV2 contributed to natural ventilation properly (Fig. 15).
Figure 15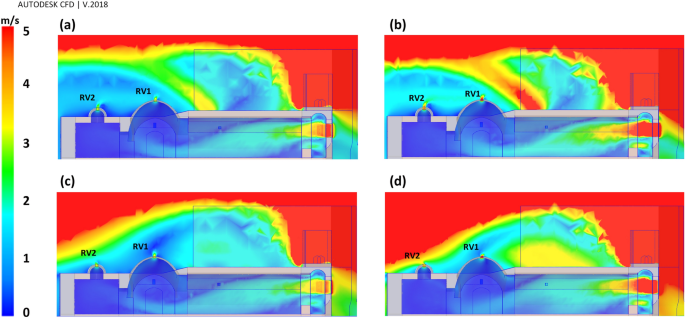
Flow pattern on the section A-A at different scenarios; (a) Sc17-10, (b) Sc17-15, (c) Sc30-10, and (d) Sc30-15.
The ({V}_{ymathrm{^{prime}}}) near the western and eastern vents, and the pressure gradient in the vents has been depicted in Figs. 16 and 17, respectively. In general, the ventilation from vents was directly correlated with the wind current near the vents.
Figure 16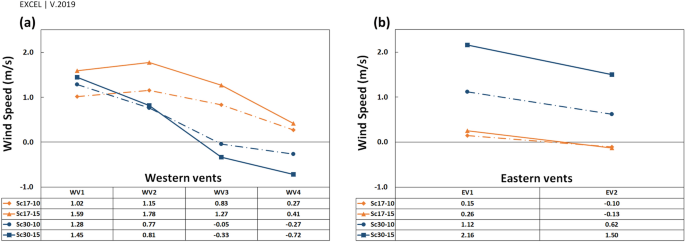
({V}_{y{^{prime}}}) of flow near the (a) western and (b) eastern vents.
Figure 17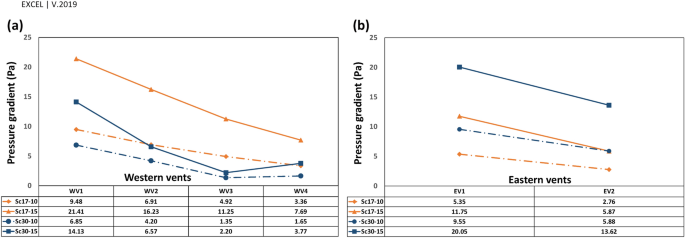
Pressure gradient in (a) western and (b) eastern vents.
The pressure gradient in vents was generally reduced upon increasing the distance from deflectors. The trend differed in WV3 and WV4 at (omega =30^circ ) (Fig. 17a) as the absolute ({V}_{ymathrm{^{prime}}}) was higher in WV4 than in WV3 (Fig. 16a).
When the wind angle was (omega =30^circ ,) no swirl formed on WV3 and WV4, and the flow currents were normal flow patterns on these vents (Fig. 13). This is due to the formation length of vortices behind deflectors. At this angle, the vortex formed before WV3 (Fig. 12), after which the flow reached zero at a specified point before this vent and then increased steadily on WV3 and WV4. Thus, the absolute wind speed in WV4 was higher than in WV3 (Fig. 16). Further, when the wind angle was (omega =17^circ ,) the vortices on eastern vents were small enough such that no vortices formed on EV2 (Fig. 13).
The flow rate (FR, ({mathrm{m}}^{3}/mathrm{h})) in vents has been calculated and depicted in Fig. 18. Apart from the flow pattern near the walls (reverse or ordinary), the flow rate was outside in all vents (i.e., vacuum). The results indicated that the maximum flow rate in all scenarios occurred in WV4 followed by EV2. Furthermore, the western vents would contribute to ventilation more than the eastern vents do, by 343% at the angle of (17^circ ) and 169% at the angle of (30^circ ), respectively.
Figure 18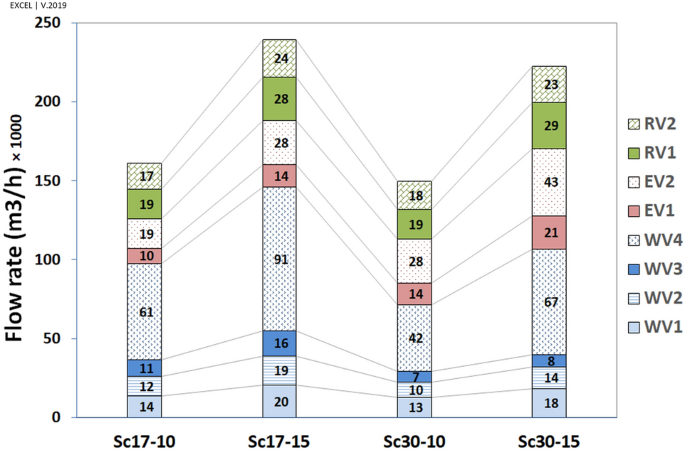
Contribution of different vents to ventilation of indoor.
The effect of windspeed on ventilation has been reported in Table 3. The results revealed that the flow rate has grown upon increasing wind speed from 10 to 15 m/s.
Table 3 Effect of wind speed on natural ventilation of the windmill.
The effect of wind direction on ventilation has been outlined in Table 4. The results revealed that when the wind direction changed from (17^circ ) to (30^circ ), the ventilation increased dramatically in eastern vents (149% on average) and decreased in western vents (73% on average). The values dropped continually upon the increasing distance from the west deflector, except in WV4 because of different flow patterns on WV3 and WV4. The ventilation in roof vents did not change with the alteration of the wind direction.
Table 4 Effect of wind direction on natural ventilation of the windmill.
The higher flow rate in WV4 and EV2 was related to the higher surface area of these two vents. Accordingly, the average speed has been calculated, with the results illustrated in Fig. 19.
Figure 19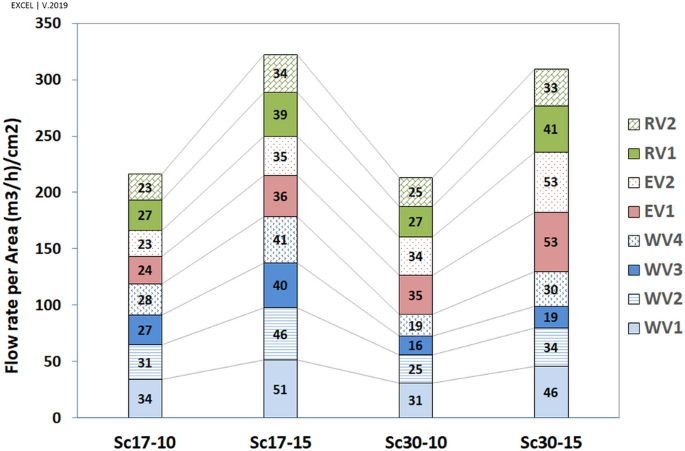
Average speed (Flow rate per area), ((left({mathrm{m}}^{3}/mathrm{h}right)/{mathrm{cm}}^{2})).
By looking at each scenario, when (omega =17^circ ), the highest and lowest average speeds occurred in WV1 and EV2, respectively. At (omega =30^circ ), the maximum and minimum average speeds took place in EV2 and WV3, respectively. Further, the lowest average speed occurred in WV3, followed by WV4 in the scenario of Sc30-10, as expected.
The analyses revealed that although the ventilation was higher on the western wall at (omega =17^circ ) by 126%, the eastern wall’s contribution to ventilation was higher at (omega =30^circ ) (Table 5).
Table 5 The comparison of average speed in western vents (WVs) to eastern vents (EVs).
Further, corridor vents (C.V.) were more effective in natural ventilation than other vents (O.V.) (Table 6). This effect was highlighted in western vents. The maximum ratio of mean average speed in three western corridor vents (WCV) to WV4 occurred at Sc30-10 because of the lowest average speed value in WV4. Furthermore, as expected, the minimum value of WV3/WV4 occurred in Sc30-15.
Table 6 The average speed ratio in corridor vents to other vents.
As stated earlier, near WV4, the flow pattern was normal in Sc30-15 and the absolute ({V}_{y{^{prime}}}) was higher than in Sc17-15 (on which the vortex has been formed), ( left| {underbrace {{V_{{yWV4}}^{{’30 – 15}} }}_{{ – 0.72}}} right| > left| {underbrace {{V_{{yWV4}}^{{’17 – 15}} }}_{{0.41}}} right| ); however, the pressure gradient and average speed had a reverse pattern, ( underbrace {{Delta P_{{WV4}}^{{30 – 15}} }}_{{3.77}} < underbrace {{Delta P_{{WV4}}^{{17 - 15}} }}_{{7.69}} ) and ( underbrace {{FRPA_{{WV4}}^{{30 – 15}} }}_{{352}} < underbrace {{FRPA_{{WV4}}^{{17 - 15}} }}_{{477}} ).
Hence, it could be concluded that the flow in vortices would affect ventilation more than ordinary currents.
Looking at Fig. 16, near the vents ({V}_{y{^{prime}}}) had the maximum rate on the west in Sc17-15 rather than in other scenarios, leading to the highest-pressure gradient and average speed. In addition, in Sc30-10 and Sc30-15, the pressure gradient and average speed changed with ({V}_{y{^{prime}}}) (Table 7).
Table 7 Relation of (left|{V}_{y{^{prime}}}right|) near the vents, (Delta P) and average speed in Sc30-10 and Sc30-15.
This pattern was different in WV1 and WV2 in Sc17-10. In this scenario, although the average speed in WV2 was lower than in WV1 (( underbrace {{FRPA_{{WV2}}^{{17 – 10}} }}_{{355}} < underbrace {{FRPA_{{WV1}}^{{17 - 10}} }}_{{393}} )), ({V}_{y{^{prime}}}) near WV2 was higher than near WV1 (( underbrace {{V_{{{y’}} _{{WV2}}}^{{17 – 10}} }}_{{1.15~{text{m}}/{text{s}}}} > underbrace {{V_{{{y’}} _{{WV1}}}^{{17 – 10}} }}_{{1.02~{text{m}}/{text{s}}}} )). This could be due to microscale eddies formed near WV1 and WV2, while the reverse current in microscale eddy near WV1 was stronger than near WV2 (Figs. 20, 21). These microscale eddies formed just when the wind speed was 10 m/s.
Figure 20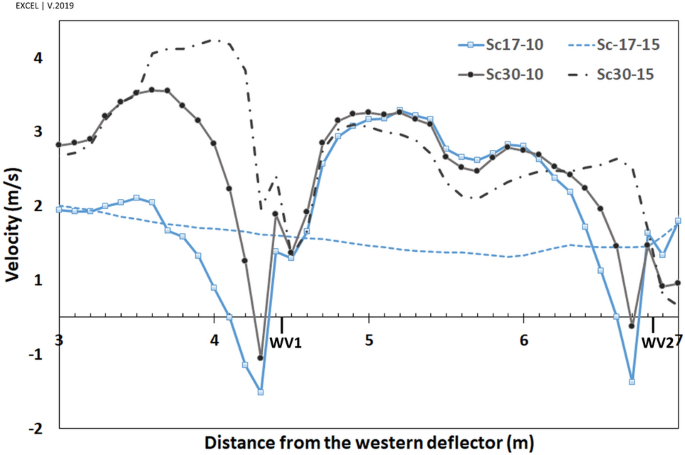
Microscale eddies near WV1 and WV2 behind the western deflector.
Figure 21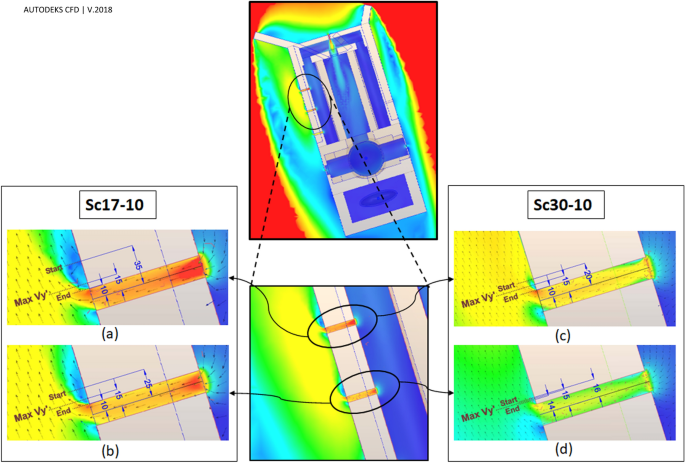
Eddies near (a) WV1 and (b) WV2 in Sc17-10 as well as (c) WV1 and (d) WV2 in Sc30-10.
Microscale eddy
At ({V}_{infty }=10 )m/s, if the wind angle was (omega =17^circ ), the micro eddy started at 35 cm away from the center of the WV1 (Fig. 21) and continued by 25 cm. In this eddy, the maximum absolute value of ({V}_{y{^{prime}}}) was (left|{{V}_{y{^{prime}}}}_{WV1}^{Sc17-10}right|=1.02 mathrm{m}/mathrm{s}), which occurred at 15 cm away from the center of the vent. In addition, the eddy was started from 25 cm to near 10 cm from the center of WV2 (the length was 15 cm), and the maximum absolute value was (left|{{V}_{y{^{prime}}}}_{WV2}^{Sc17-10}right|=0.13 mathrm{m}/mathrm{s}), occurring at a distance of 15 cm. When ({V}_{infty }=10 mathrm{m}/mathrm{s}) and (omega =30^circ ), the eddy formed from 20 to 10 cm from WV1 (the length was 10 cm) where the absolute maximum value was (left|{{V}_{y{^{prime}}}}_{WV1}^{Sc30-10}right|=0.56 mathrm{m}/mathrm{s}). Finally, in the same scenario and near WV2, the eddy formed 16 cm to 14 cm from the center of the vent (2 cm length) with the maximum value of (left|{{V}_{y{^{prime}}}}_{WV2}^{Sc30-10}right|=0.13 mathrm{m}/mathrm{s}) 15 cm away from the vent center.
Thus, as the maximum reverse flow occurred at the eddy in Sc17-10 near WV1, ({V}_{y{^{prime}}}) has diminished more near this vent in this scenario than in others (Fig. 16).
In addition, according to Fig. 16, the minimum ({V}_{y{^{prime}}}) in WV1 occurred in Sc17-10, resulting from the described micro-scale eddy.
Thermal comfort and indoor air quality
The results indicate that the mean value of indoor air velocity in the four considered scenarios was about 0.31 m/s. On the other hand, in naturally ventilated buildings, the occupants’ thermal comfort must be evaluated based on adaptive thermal comfort models. As such, in the present study, we use the adaptive thermal comfort model of ASHRAE standard 55-202072. Thus, by considering the summer outdoor mean temperature of the Sistan region (about 33 °C) and mean air velocity of 0.31 m/s, the adaptive comfort model reveals that without using any mechanical cooling systems for the indoor space of the windmill, the occupants’ thermal perception lies within the comfort range with 80% acceptability limit.
IAQ depends on various parameters such as air flow rate, air change rate, and local mean age of air (LMA) in a 1.5 m horizontal plane (level of standing human in activities). Since the air change per hour (ACH) parameter was extensively used in similar studies, this criterion has been utilized for evaluating the IAQ.
Air change per area
The air change per hour, ACH (/h), was calculated through dividing the integrated vent velocities by the room volume, V (Eq. 8)
$$ACH=3600.frac{int overrightarrow{v}.dA=frac{1}{2}sum_{k}sum_{j=1}^{n}left|{v}_{j}.{n}_{j}right|.{A}_{j}}{V}$$
(8)
where ({v}_{j}) is velocity vector, ({n}_{j}) is the ordinary vector to the vents surface, ({A}_{j}) represents the area of jth cell, n is the total number of cells at the vents, and k shows the number of vents in the building.
The results (Fig. 22) showed that all scenarios were beyond the ASHRAE standard for residential buildings (ACH = 0.35)73,74. This figure indicates that air change increases when the wind blows faster. One of the interesting findings is that the air change diminished by increasing the wind angle.
Figure 22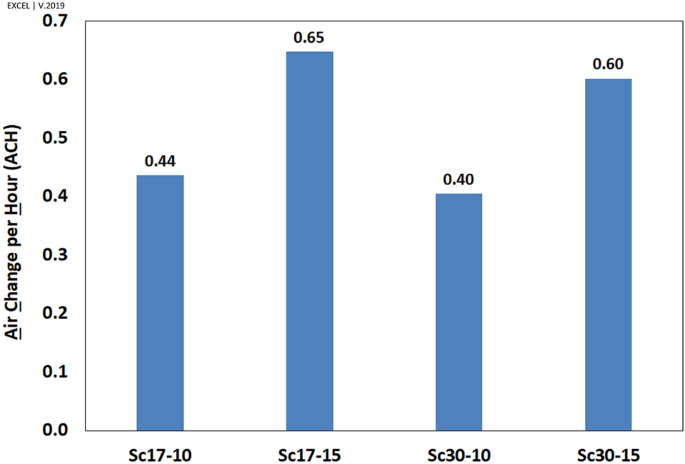
Air change per hour (ACH) in the windmill in different scenarios.
Application in modern architecture
The application of wind in the ventilation of vernacular buildings was explained in various literature. Indeed, the important issue is how we can enhance the ventilation rate in modern architecture with this knowledge. Projects such as Kidderminster College75, and Windcatcher Zero76 are the cases that utilize natural ventilation in modern architecture7,36. The characteristics of the studied structure, including its orientation, the use of deflectors, and the shape and placement of vents as well as corridors can be a suitable model for harnessing the wind in indoor air exchange. Further, each of the mentioned approaches (such as the effect of negative pressure43 behind deflectors) or a combination of these approaches can be proposed as an effective solution for cross or single-side ventilation strategies. For example, this system could be recommended as a suitable auxiliary solution for the proper ventilation process in large public spaces such as halls, museums77, warehouses, enclosed stadiums78, and factories, which on the one hand, overcrowding increases the indoor-induce pollutants79 in the space, and on the other hand, the cost of ventilation in these places is high.
[ad_2]
Originally Appeared Here