Effect of air flow rate and residence time on size distribution and number concentration
Experiments were performed using an atomizer solution without virus particles. Path A of Fig. 1 was utilized in the experiments. Details of the experimental devices are presented in “Methods” section. The variables for the different types of diffusion dryers are listed in Table 1.
Figure 1
Schematic of the experimental design used to generate aerosol particles.
Table 1 Characteristics of different types of diffusion dryers used during experiments.
The residence time, τ, of the air flow in the diffusion dryers calculated using the following equation:
$$uptau =sum _{{rm i}=0}^{{rm i}=mathrm{n}}frac{uppi {mathrm{w}}_{{rm i}}^{2}{mathrm{L}}_{{rm i}}}{4{upgamma {rm Q}}}$$
(1)
where n denotes the number of diffusion dryers, ({mathrm{w}}_{{rm i}}) denotes the tube diameter of the ({mathrm{i}}_{{rm th}}) diffusion dryer, ({mathrm{L}}_{{rm i}}) denotes length of the ({mathrm{i}}_{{rm th}}) diffusion dryer, Q is the AFR (2 to 5 L/min), and (upgamma) is a constant corresponding to 1.67 × 10⁻⁵ (min m3/L s).
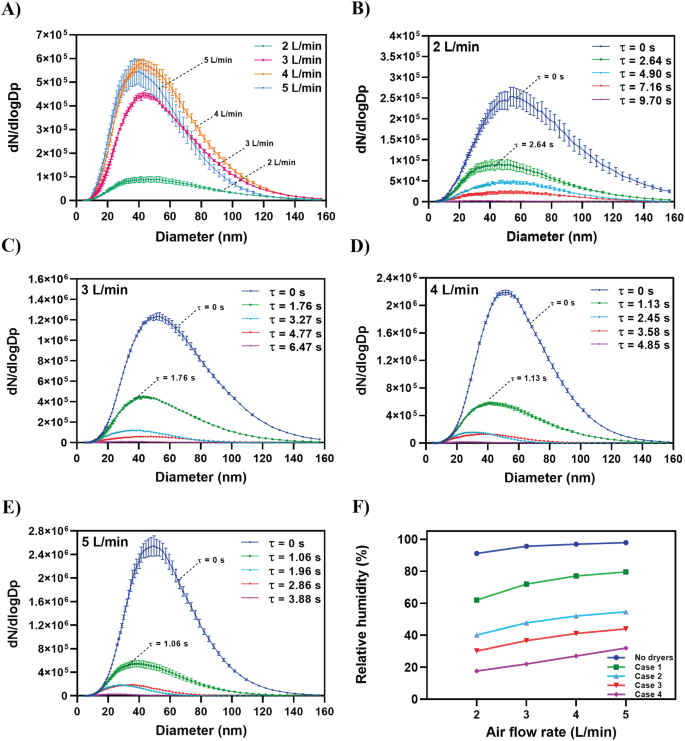
Figure 2A shows the number concentrations and size distributions of the aerosolized water droplets at different AFRs when using one diffusion dryer (Case 1, Table 2). The water droplet size ranged from 4 to 160 nm. When AFR increased, the residence time decreased, and the droplet number concentration increased. Figure 2B, C, D, and E shows the effects of the residence time in the diffusion dryers (Table 2) at constant AFRs corresponding to 2, 3, 4, and 5 L/min, respectively. The original water droplet size distributions right after the air stream exiting the atomizer (τ = 0) were measured. The results are shown in Fig. 2B, C, D and E. The results indicate that the concentration of aerosolized water droplets decreased as the residence time increased. Figure 2F shows that the relative humidity (RH) decreased by 10% when the AFR decreased from 5 to 2 L/min for all cases. At a constant flow rate, the RH decreased by approximately 70% in Case 4.
Figure 2
Effects of air flow rate and residence time in diffusion dryers on number concentration and size distribution of the aerosolized water droplets. (A) Case 1: one diffusion dryer is used (Table 2). (B) Air flow rate is 2 L/min, and residence time of 2.64, 4.90, 7.16, and 9.70 s represent Case 1, Case 2, Case 3, and Case 4, respectively (Table 2). (C) Air flow rate is 3 L/min, and residence time of 1.76, 3.27, 4.77, and 6.47 s represent Case 1, Case 2, Case 3, and Case 4, respectively (Table 2). (D) Air flow rate is 4 L/min, and residence time of 1.13, 2.45, 3.58, and 4.85 s represent Case 1, Case 2, Case 3, and Case 4, respectively (Table 2). (E) Air flow rate is 5 L/min, and residence time of 1.06, 1.96, 2.86, and 3.88 s represent Case 1, Case 2, Case 3, and Case 4, respectively (Table 2). (F) Effect of the air flow rate on RH is shown for each case.
Table 2 Overview of different dryer combinations, air flow rates, and corresponding residence times.
The details of the results in Fig. 2 are presented in Table S1 in Supplementary Materials. For example, when an AFR of 2 L/min was used, applying different residence times reduced the total droplet number concentrations to 5.9 × 104 cm–3 (τ = 2.64 s), 3 × 104 cm–3 (τ = 4.90 s), and 1.6 × 104 cm–3 (τ = 7.16 s), which correspond to 60%, 80%, and 89% decrease in total number concentration, respectively. Table S1 shows the changes in the total number concentration of generated droplets for different residence times and flow rates. The results indicated that the total droplet number concentration exponentially decreases when residence time increases for all tested flow rates.
Total number concentration as an exponential decay regression
Conversely, for each case (Table 2), the total number concentration increased with increases in the flow rate. Thus, the total number concentration of droplets (({mathrm{N}}_{{rm t}})) can be described as an exponential decay function of the residence time ((tau)) as follows:
$${mathrm{N}}_{{rm t}}(uptau )={mathrm{N}}_{0}mathrm{exp}(-mathrm{ktau })$$
(2)
where ({mathrm{N}}_{0}) and k denote the total number concentration of droplets at τ = 0 (cm–3) and decay constant (1/s), respectively; both are linearly proportional to the flow rate:
$${mathrm{N}}_{0}={upalpha {rm Q}}$$
(3)
$$mathrm{k}={upbeta {rm Q}}$$
(4)
where Q denotes the flow rate (L/min). The constants (alpha) and (beta) correspond to 2.31 × 10⁵ min/L cm3 and 0.251 min/L s, respectively. The results are listed in Table 3.
Table 3 Values of ({N}_{0}) and k coefficients and R2 for the non-linear, exponential decay regression ([{N}_{t}(tau )={N}_{0}exp(-ktau )]).
Optimal residence time in diffusion dryers for maximizing droplet removal
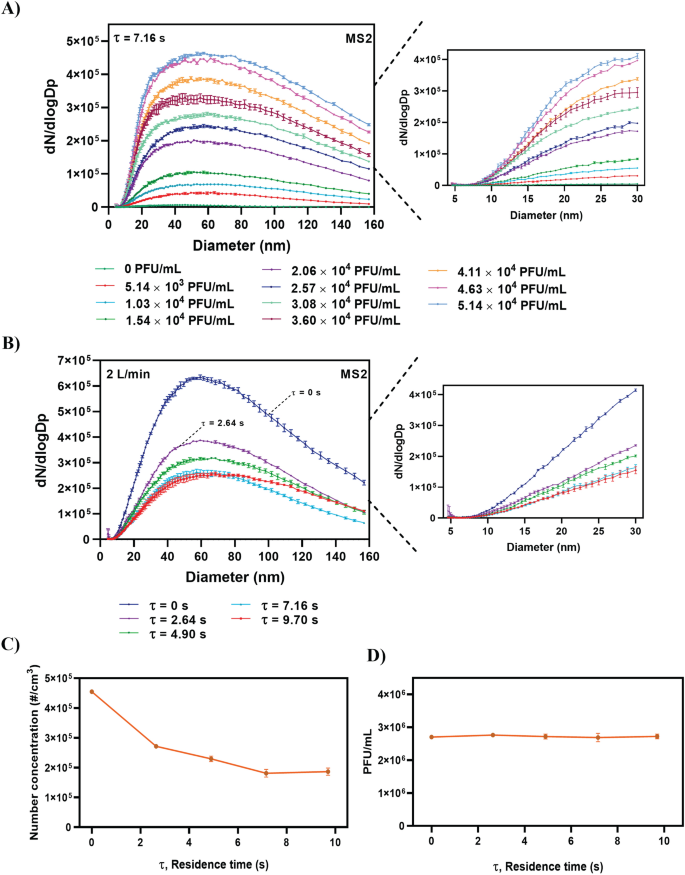
The test results for the MS2 bacteriophage aerosols are shown in Fig. 3. Specifically, Fig. 3A shows the effect of the MS2 virus concentration on the size distribution of the aerosolized particles at an AFR of 2 L/min for Case 3 (τ = 7.16 s). The total number concentration increased when the MS2 virus concentration increased. Figure 3B shows that an increase in the residence time leads to a decrease in the number concentration of aerosolized particles at a constant AFR of 2 L/min. However, after a residence time of 7.16 s, the number concentration of the aerosolized particles remained constant (Fig. 3C), thereby indicating that this corresponds to a sufficient diffusion drying time that maximizes droplet removal at an AFR of 2 L/min.
Figure 3
Effects of different MS2 virus solution concentrations and residence times on number concentration and size distribution of the aerosolized MS2 bacteriophage. (A) Effect of different MS2 virus solution concentrations on size distribution and concentration of the aerosolized particles at (tau) = 7.16 s (Table 2). (B) Effect of different residence times on size distribution and concentration of the aerosolized particles under a constant air flow rate of 2 L/min. (C) Effects of different residence times on total number concentration of aerosolized MS2 virus. (D) Plaque analysis results for the sampled MS2 bacteriophage virus under different residence times.
While the SMPS data (Fig. 3C) showed that the total number concentration varied with residence time, it is interesting to note that the plaque assay results remained constant with an average of 2.72 × 10⁶ plaque forming units per milliliter (PFU/mL) for each case (Fig. 3D). Virus aerosols were sampled for the plaque assay through the experiment setting shown in path B of Fig. 1. A gelatin filter was used. The virus concentration of 2.72 × 10⁶ PFU/mL on the gelatin filter corresponded to a total virus number of 1.8 × 10⁹ on the gelatin filter, which was obtained from the collection of aerosolized MS2 virus particles per 1 cm3 of air volume, at an AFR of 2 L/min and sampling time of 5 min (1.8 × 10⁵ virus particles/cm3 for τ > 7.16 s, see Fig. 3C).
The collection efficiency of the filter remained constant at 97% for all the cases. However, for τ < 7.16 s, the concentration of 2.72 × 10⁶ PFU/mL corresponded to a total virus number exceeding 1.8 × 10⁹. This was because the SMPS data for τ < 7.16 s were affected by non-dried water droplets as opposed to virus aerosols alone. The SMPS data in Fig. 3C were used to calculate error using Eq. (5). The following equation was used to quantify the effect of water droplets on the total number concentration of virus aerosol.
$$mathrm{Error}(%)=frac{mathrm{N}-{mathrm{N}}_{{max}}}{{mathrm{N}}_{{max}}}times 100$$
(5)
where N denotes the total number concentration for a residence time (uptau), and ({mathrm{N}}_{{max}}) denotes the total number concentration for the time required for maximum droplet removal.
For example, when τ = 0 s and total number concentration is 4.55 × 105 cm−3 (N), the error in the total number concentration measurement is approximately 151% when considering 1.8 × 105 cm−3 (({mathrm{N}}_{{max}})) at a sufficient drying time (τ = 7.16 s). Similarly, for τ = 2.6 s and a total number concentration of 2.7 × 105 cm−3, the error decreases to approximately 50%.
[ad_2]
Originally Appeared Here