“On the Benefits of Whole-building IAQ, Ventilation, Infiltration, and Energy Analysis Using Co-simulation between CONTAM and EnergyPlus”
W. Stuart Dols, Chad W. Milando, Lisa Ng, Steven J. Emmerich, and Jyrteanna Teo
CONTAM – developed by the National Institute of Standards and Technology (NIST)
- A publicly free, multizone airflow and contaminant transport analysis software that’s been frequently under construction and development since the 1980s.
- Can simulate whole-building ventilation and indoor air quality, but does not have the capability to run heat transfer analysis. Users are prompted to provide indoor air temperature inputs because air temperature has an effect on the way particles are transported through the air.
EnergyPlus:
- Also a publicly free software, developed by the Department of Energy (DOE), that has the capability to simulate multizone, whole building heat transfer analysis. This also includes controlling and sizing necessary HVAC equipment.
The important thing to note is that both softwares provide useful technology, but have limitations when used by themselves. Combining these two softwares provides a more comprehensive analysis for potential energy and indoor air quality improvements. During the co-simulation, depending on which softwares are designated as primary and secondary, a whole list of data is exchanged between the two softwares. When working from EnergyPlus to CONTAM, the zone temperatures, relative humidity, ventilation system airflow rates, outdoor airflow fractions, exhaust fan airflow rates, outdoor environmental data, along with a few other desired output variables are exchanged. On the other hand, when working from CONTAM to EnergyPlus, only a few of these values are exchanged: the zone infiltration airflows, the inter-zone airflows, and the controls values.
In the report, a multifamily building model was selected from a selection of building model prototypes made by the Pacific Northwest National Laboratory (PNNL) that was originally constructed in EnergyPlus for the DOE. The model contains 6 single zone units without any enclosed stairwells or building shafts. This model was used in a CONTAM simulation, an EnergyPlus simulation, and then finally a co-simulation.
The Contam3DExport program tool and the ContamFMU dynamic link library tool were used to aid the co-simulation process between EnergyPlus and CONTAM. The 3DExport tool creates IDF files from the PRJ files and makes coordination easier during the co-simulation, while the FMU dynamic link library aids the exchange of data in the CONTAM simulation engine, ContamX. Below is a screenshot from the report showing the interconnections between the softwares and subprograms.
First, inputs must be put into the EnergyPlus model for the following systems:
- Infiltration
- Ventilation
- Contaminant
In the model used strictly in EnergyPlus, the infiltration inputs for the surface areas of the top and middle apartments, the following equation was used:
Infiltration =AL/1000*CsT+Cws*Ws2
This model was used to determine the whole-building infiltration rates for a whole year with the building location set to Boston Massachusetts.
For the co-simulation model, the EnergyPlus model results were taken and then modified using the following equation:
Infiltration =Idesign(A+B|T|+D*Ws2)
Where Idesign was set to 3.72×10^-4 m3/s per m2 of exterior building surface area, respectively.
For the ventilation, the basic model’s exhaust ventilation was determined using the ZoneVentilation:DesignFlowRate method from EnergyPlus. Using this method allows the software to increase outdoor air intake in order to account for more than just the standard infiltration rates; this is an empirical method, as compared to a physics-based method that’s normally used by multizone and network airflow modeling tools. However, when using the CONTAM co-simulation, this measure is not needed, as CONTAM takes care of these calculations in its own software.
Finally, for the contaminant inputs, both CO2 and PM2.5 were considered. EnergyPlus can simulate CO2 (from building occupant inputs) and can then model and size demand-controlled ventilation. The outdoor CO2 concentration was set to 731.8mg/m3, or 400 ppm, while the maximum CO2 generation was set to 4.48×10^-6 m/s*person. The maximum CO2 generation value was determined using an maximum internal heat gain of 117.28 W/person, assuming 2 people per unit, and also assuming an occupant CO2 emissions rate of 3.82×10^-8 m3/s*W. The location of Boston Massachusetts was also important to the contaminant inputs because average measurements were taken from that location’s historical files. An indoor cooking source of 1.56 mg/min was scheduled for 30 total minutes every day (7-7:10 am and 6-6:20 pm) with a particle deposition rate of 0.19 1/hr in each separate zone. The CONTAM co-simulation models were also given recirculation filters with an envelope penetration factor of 0.72 for PM2.5.
After each of the models had their correct inputs, they were all run and graphs of their energy usage, infiltration rates, contaminant transport, and design airflow rates to handle PM2.5 were constructed. I have included screenshots with short summaries below.
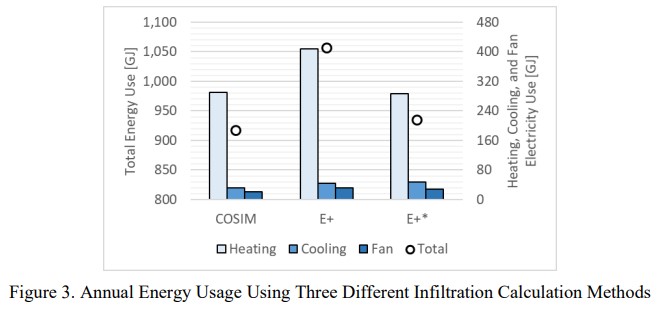
This graph shows the relationships between the heating, cooling, fans, and total energy loads for the three different simulations of the same building model. Obviously heating is the highest load as the building location is set to Boston Massachusetts. It’s interesting to see that the combined EnergyPlus and CONTAM simulation more directly correlates to the sole CONTAM model. EnergyPlus had a much higher heating load than CONTAM, and the combined model doesn’t quite meet in the middle of the two values.

This figure shows the relationships between the Cw values (initial input calculations) and the three different simulations. Again it’s interesting to note that EnergyPlus had consistently higher calculation values, especially for the top and bottom apartment units.

These graphs show the relationships between the initial calculation inputs along with the 3 simulations for the daily average CO2 and PM2.5 emissions. In these graphs, the co-simulation model more closely matches the strictly EnergyPlus model, as compared to the infiltration graphs from earlier where the co-simulation model more closely matched the CONTAM model.

Lastly, this figure shows the relationships between each of the units HVAC design air flow rates for just the EnergyPlus and CONTAM models. The co-simulation model was not used for this graph. The biggest difference between each of the simulations is seen in the first level front unit. The EnergyPlus model gave a design airflow of over 1000 m3/hr, while the CONTAM model gave a design airflow for the same space at about 600 m3/hr – almost half the amount of air as the EnergyPlus model called for. This is interesting because none of the other units have such a drastic difference between the two modeled simulations.
Citations:
All images from:
(PDF) On the Benefits of Whole-building IAQ, Ventilation, Infiltration, and Energy Analysis Using Co-simulation between CONTAM and EnergyPlus (researchgate.net)
Like this:
Loading…
[ad_2]
Originally Appeared Here