Characterization of the clinoptilolite zeolite (CZ)
SEM analysis was used to study the morphological features of CZ. Figure 1a shows the SEM image of CZ. It can be seen that the sample has an irregular perforated crystalline texture, which is layered on top of each other. Such a pattern provides suitable adsorption sites for the absorption of different species of contaminants.
Figure 1
(a) SEM image and (b) XRD pattern and (c) adsorption desorption isotherm of CZ.
The sample structure was studied by XRD analysis. XRD analysis was assessed in the 2θ range of 5° and 50°. The XRD diagram (Fig. 1b) of clinoptilolite revealed diffraction peaks at 2θ values of 9.7°, 22.4°, 26.8°, 30.2°, and 32.8°, which correspond to biotite (Bi), Clinoptilolite (Clp), quartz (Qtz), feldspar (Fel), and dolomite (Dol), respectively. These results are consistent with the XRD data of clinoptilolite reported in the literature39,40.
CZ structure information was determined by N2 gas adsorption analysis at 77.3 K in the relative pressure range (P/P0) of 0.998. The test sample was degassed for 2 h at 120 °C. The values of specific surface area, total volume of pores, and average diameter of pores were measured by the standard BET method. According to this analysis, the surface area, micropore volume, and pore diameter were 15.01 m2 g-1, 0.1947 cm3 g-1, and 0.0174 μm, respectively (Fig. 1c).
Central composite design (CCD)
In the present study, the parameters affecting the process were optimized using the CCD. The design of four parameters, including sonication time, adsorbent amount, pH, and contaminant concentration, was studied at five levels. The factors and experimental results are shown in Table 1. Experimental results and predicted results are shown in Table S1.
Table 1 The design of CCD.
Statistical analysis was conducted with version 10 of Design-Expert Software (DX 10). The response function and the obtained experimental data were fitted using the quadratic and linear effects of the independent variables and regression coefficients. Also, the analysis of variance (ANOVA) results were used to estimate significant differences between variables and their interaction. Regression coefficients and ANOVA of the quadratic equation of polynomials in removing contaminants are summarized in Tables S2 and S3. According to Tables S2 and S3, all linear effects (A, B, C, and D) and all quadratic effects (A2, C2, B2, and D2) were significant with a 95% confidence level. The F-value of all models was very high (at 95% significance), confirming the validity of the models. High values of R2 (more than 99% for all analytes) indicated good agreement of the model with experimental data. There was no significant difference between R2 and R2-Adj values, indicating a high correlation between the experimental and predicted results. Also, the insignificance of the lack of fit (P ˃ 0.05) revealed the good fitness of the predicted model. Adequate precision was employed to evaluate the adequacy of the models. The adequate precision is determined by comparing the predicted response values at the design points with the average prediction error. The adequate precision in this study was more than 4 for all models, suggesting that the model was acceptable. The two-level response of the second-order polynomial equation for CV, MG, Cd(II), and Pb(II) is shown in Eqs. 4–7, respectively.
$$ begin{aligned} % {text{Removal }}left( {{text{CV}}} right) & = + {87}.{13} + {1}0.{63}0{text{A}} + {8}.{text{68B}} – {9}.{text{56C}} + {8}.{text{69D}} \ & quad + 0.{text{19AB}} – 0.{text{81AC}} – 0.{text{24AD}} – 0.{text{53BC}} + {1}.{text{15BD}} \ & quad + {1}.0{text{3CD}} – {7}.{8}0A^{2} – {1}0.{31}B^{2} – {4}.{11}C^{2} – {5}.{48}D^{2} \ end{aligned} $$
(4)
$$ begin{aligned} {text{oval}};left( {{text{MG}}} right) & = + {9}0.{41} + {11}.{text{28A}} + {11}.{text{84B}} – {1}0.{text{46C}} + {7}.{text{21D}} \ & quad + {1}.{text{35AB}} – {1}.{text{89AC}} – 0.0{text{9AD}} – {2}.{1}0{text{BC}} – 0.{text{38BD}} \ & quad – 0.{text{19CD}} – {11}.{1}0A^{2} – {13}.{16}B^{2} – {6}.{3}0C^{2} – {5}.{1}0D^{2} \ end{aligned} $$
(5)
$$ begin{aligned} % {text{Removal}};left( {{text{Cd}}left( {{text{II}}} right)} right) & = + {87}.{25} + {8}.{text{98A}} + {7}.{text{49B}} – {9}.{4}0{text{C}} + {6}.{text{21D}} + {1}.0{text{8AB}} \ & quad + 0.{5}0{text{AC}} + {1}.{text{41AD}} – 0.{text{64BC}} – 0.0{text{7BD}} \ & quad + {1}.{text{18CD}} – {6}.0{6}A^{2} – {8}.{41}B^{2} – {5}.{49}C^{2} – {5}.{65}D^{2} \ end{aligned} $$
(6)
$$ begin{aligned} % {text{Removal }}left( {{text{Pb}}left( {{text{II}}} right)} right) & = + {91}.{72} + {7}.{text{12A}} + {8}.{text{74B}} – {8}.{text{64C}} + {3}.{text{81D}} + {1}.{text{39AB}} \ & quad – 0.{text{11AC}} + 0.{text{54AD}} + 0.{text{53BC}} – 0.0{text{6BD}} \ & quad + 0.{text{62CD}} – {6}.{97}A^{2} – {7}.{99}B^{2} – {5}.{98}C^{2} – {5}.{6}0D^{2} \ end{aligned} $$
(7)
In these equations, A, B, C, and D were the adsorbent amount (g), pH of the solution, analyte concentration (mg L−1), and sonication time (min), respectively. The next step in evaluating the proposed models is to analyze the residual graphs. Figure 2a–d show a good correlation between the experimental values and the predicted values. Regression models had a high R2, indicating the validity of the selected models.
Figure 2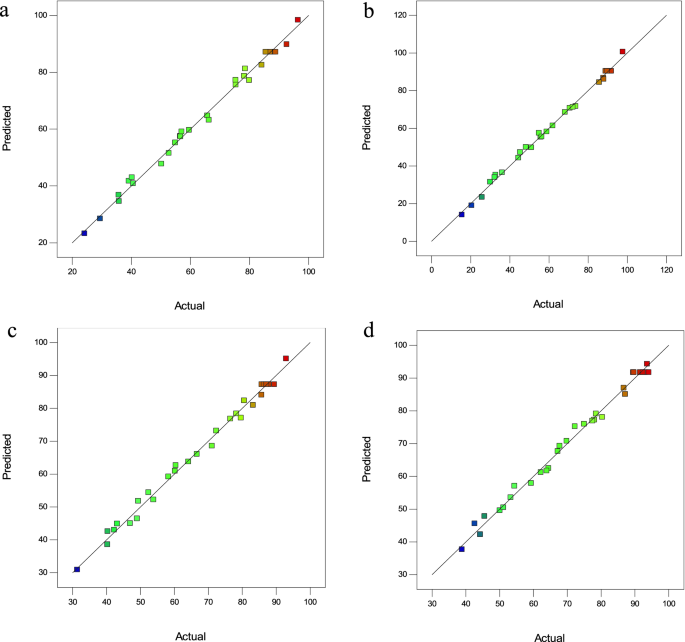
Predicted versus actual removal efficiency plots (a) CV, (b) MG, (c) Cd(II), and (d) Pb(II).
Residuals, which are the difference between the experimental and predicted removal efficiency, are useful for evaluating the importance of a model. Figure 3a–d shows the normal probability compared to the residuals. As can be seen, the residual points create a straight line. These plots confirmed the applicability of the model.
Figure 3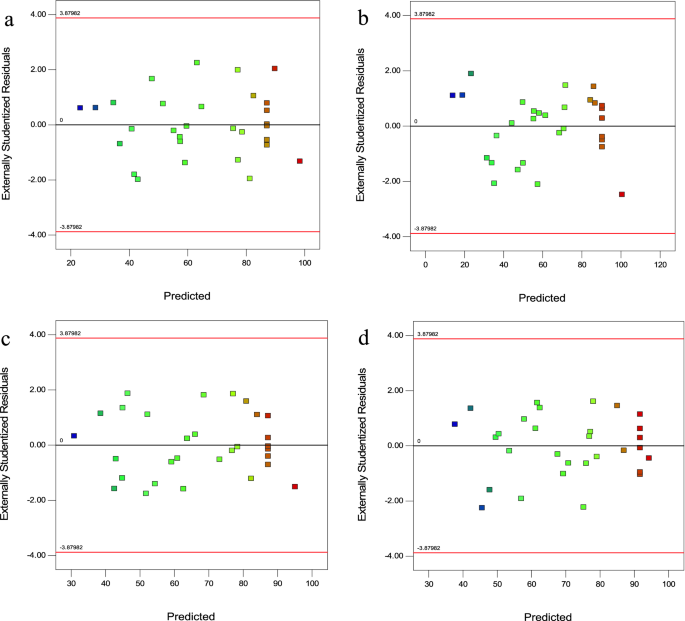
Plot of residuals versus predicted (a) CV, (b) MG, (c) Cd(II), and d) Pb(II).
The normality of the data was studied with a plot of residuals’ normal probability. The normal plot of residuals in Fig. 4a–d indicates a random scatter of residuals compared to the expected values, indicating a satisfactory model fit.
Figure 4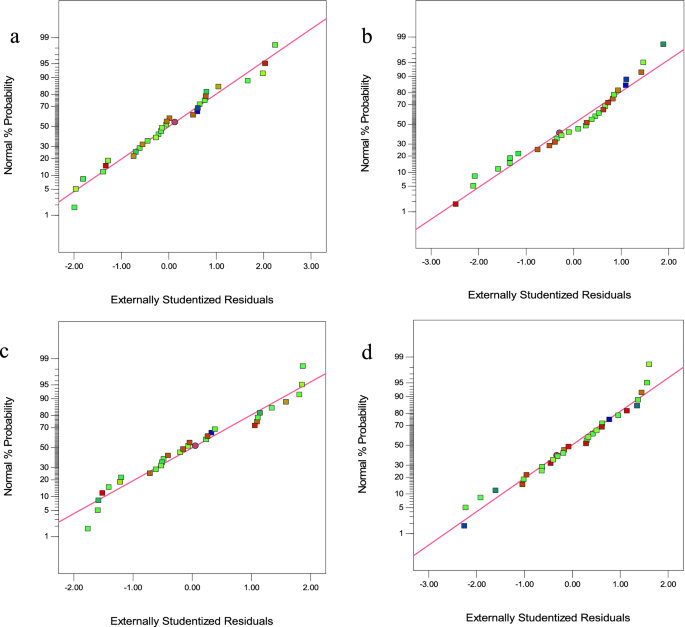
The normal plot of residuals (a) CV, (b) MG, (c) Cd(II), and (d) Pb(II).
The three-dimensional (3D) plots
To assess the interaction of all four parameters, three-dimensional (3D) graphs were designed for the predicted responses based on the quadratic model. Response surface graphs are often employed to estimate removal efficiencies for different values of experimental parameters. Using the CZ adsorbent, this study investigated and optimized the parameters affecting the removal efficiency of CV, MG, Cd(II), and Pb(II). Three-dimensional diagrams of the simultaneous effect of adsorbent amount (A), pH (B), contaminant concentration (C), and sonication time (D) are shown in Fig. 5a–d.
Figure 5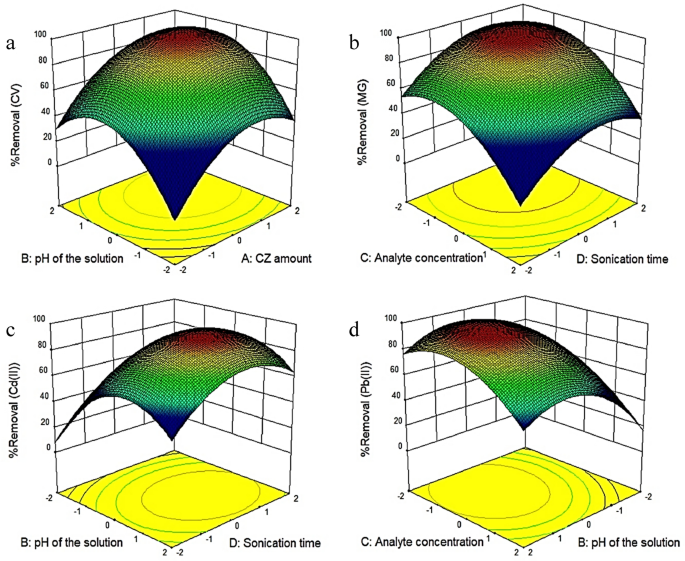
Three-dimensional plots of the interaction effects between variables and removal of (a) CV, (b) MG, (c) Cd(II), and (d) Pb(II).
Figure 5a displays the simultaneous effect of the adsorbent amount and the pH of the solution on the amount of CV dye removal. The results show that the percentage of CV dye removal has increased with increasing the adsorbent amount to the extent that the intensity of changes decreases. The explanation for this increase is that with increasing the adsorbent amount, the number of active sites for the absorption of contaminants increases. According to the results, the optimum value for the adsorbent amount was 0.19 g. These results are consistent with Bagheri et al.41, who studied the removal of lead and cadmium from aqueous solutions. In this study, rGO-Fe0/Fe3O4-PEI nanocomposite was used as the adsorbent. Next, the effect of different variables such as the adsorbent dosage, ultrasound time, dye concentration, and pH on the amount of dye removal was examined. This study showed that the amount of dye removal increases with increasing the adsorbent amount41. Asfaram et al. (2015) employed ZnS:Cu nanoparticles loaded on activated carbon (ZnS:Cu-NP-AC) as an adsorbent for the removal of Auramine-O (AO) dye from an aqueous solution. They found that the percentage of contaminant removal increases with increasing the adsorbent amount42.
Figure 5a illustrates the effect of pH on CV removal efficiency. The 3D plot shows that the dye removal percentage increases with the pH. CV is a cationic dye, and since the adsorbent surface becomes positive in an acidic environment, less adsorption occurs on the adsorbent surface due to the electrostatic repulsion between the positive charges of the dye and the adsorbent. Hence, the removal rate of CV in acidic environments is low. Moreover, the percentage of lead removal also increased with increasing pH, and the maximum lead removal was achieved at pH 6 (Fig. 5d). Since the pHzpc of CZ is 3, there is a positive charge on the surface of CZ at pHs below 343,44,45. Therefore, at pHs lower than 3, the electrostatic repulsion between the positively charged metal and the positive charge on the adsorbent surface would reduce the lead removal rate. On the other hand, with increasing pH, the adsorbent surface becomes more negative; therefore, the adsorption of metal cation increases. As the pH increases, the metal ion removal efficiency initially increases and then decreases. The reason is that at pHs above 6, lead hydroxide (Pb(OH)2) and cadmium hydroxide (Cd(OH)2) are formed, which are insoluble and precipitate. Similar results have been reported by Palma-Anaya et al., Shi et al., and Rahimi et al.46,47,48.
The simultaneous effect of MG concentration and sonication time on the percentage of MG removal is shown in Fig. 5b. According to Fig. 5b, the removal efficiency decreased by increasing the dye concentration from 5 to 25 mg L−1. The explanation is that the surface of nanoparticles is saturated in the presence of a higher concentration of dye molecules. Dye molecules tend to aggregate on the outer surface of nanoparticles, reducing the adsorption rate. Hence, lower dye concentrations can be easily absorbed on the adsorbent surface. Chauhan et al.49 obtained similar results in removing bromophenol blue (BB) dye. The effect of various parameters such as pH, response time, dosage amount, and concentration of BB on the removal rate was also investigated. The results revealed that increasing the dye concentration reduced the removal rate, which is consistent with the present study results49. Also, Awual50 obtained similar results in investigating dye concentration’s effect on Cd(II) removal rate. This study applied the ligand-coated porous composite material as an adsorbent to remove Cd(II). According to the results, increasing the concentration of Cd(II) reduced the removal rate50.
Figure 5c exhibits the effect of sonication time on Cd(II) removal rate. The removal efficiency generally increases with increasing contact time and reaches a constant value in the equilibrium state. Therefore, sonication time can affect the contaminant removal efficiency due to its effect on the analyte mass transfer. Sonication time was assessed from 5 to 25 min. According to the results, Cd(II) removal was first increased with increasing the sonication time. However, no significant change in removal was observed after 22 min. The explanation is that in these conditions, the contact between the adsorbent and the metal ion is high, leading to mass transfer and removing the contaminants. Khalifa et al.51 obtained similar results in the removal of Cd(II), Hg(II), and Cu(II) ions using mesoporous silica nanoparticles modified with dibenzoylmethane. Arabkhani and Asfaram52 obtained similar results for removing MG dye from an aqueous solution using a three-dimensional magnetic polymer aerogel. This study investigated the effect of various parameters (e.g., adsorbent amount, initial dye concentration, temperature, contact time, and pH of dye solution) on the amount of dye removal. Consistent with the present study, the results indicated that the removal percentage increased with increasing the sonication time52.
Process optimization
One of the main objectives of this study was to identify the optimum conditions for maximizing the removal efficiency of contaminants using the proposed mathematical model53,54. For this purpose, numerical optimization was utilized to determine the desired values of each parameter and obtain the maximum removal rate. The results of contaminant removal optimization are presented in Table 2. The numerical optimization results showed that the maximum removal efficiency could be achieved with an adsorbent of 0.19 g, an analyte concentration of 10 mg L−1, a pH of 6, and a sonication time of 22 min. The obtained results were validated by conducting an additional experiment under optimum conditions. It was found that under optimum operating parameters, the experimental removal efficiency was more than 92.67% for all analytes, suggesting the model’s predictability for use in real conditions.
Table 2 Optimum conditions of removal of CV, MG, Cd(II) and Pb(II).
Effect of interfering ions
It is often very difficult to remove the desired analytes from different matrices containing different ions. For this purpose, the effect of interfering ions of Na+, Mg2+, Al3+, Ba2+, Fe3+, and F- was studied to obtain a minimum of 95% analyte adsorption signal in the presence of different anions and cations during the process. During the experiment, different ions at different concentrations were added individually to the solution containing CV, MG, Cd(II), and Pb(II), and tolerance limits were determined. Interfering ions and their tolerance limits are presented in Table 3.
Table 3 Effect of interfering ions on the removal of MG, MB, Cd(II) and Pb(II).
The reusability of CZ
The reusability of the adsorbent is a critical aspect that makes the adsorbent effective for practical applications. Therefore, the reusability of CZ was examined under optimized conditions to remove contaminants (Fig. 6). The CZ adsorbent was separated from the solution by centrifugation at 3000 rpm (for 10 min). The adsorbent was washed with 5 mL of HNO3 solution (0.1 M). Finally, the adsorbent was washed several times with distilled water and dried at 80 °C. This process was repeated after each experiment. It was observed that the removal efficiency decreased by about 10% after five consecutive runs. This result demonstrates that CZ adsorbent is reusable and stable for removing contaminants from environmental water samples.
Figure 6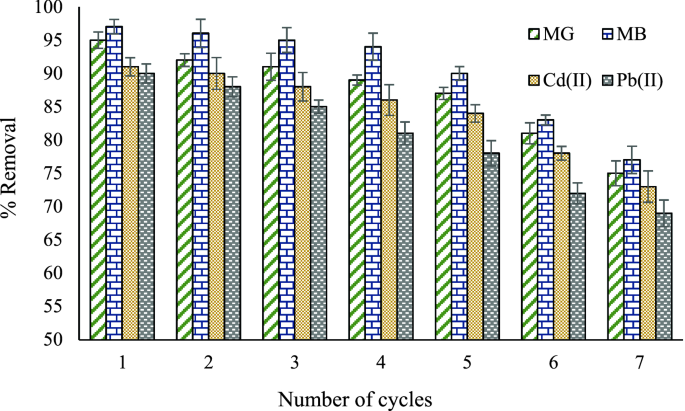
The reusability of CZ in the removal of pollutants under optimized parameters.
Real sample analysis
The adsorption capacity of CZ was studied in various real water samples (e.g., tap water, well water, river water, and fish farm) to confirm the system’s efficiency. In this analysis, the proposed water samples with specific concentrations of contaminants were spiked under optimum conditions. After performing the relevant experiment, the efficiency of the CZ adsorbent was calculated using the given method (Table 4). Therefore, the adsorbent can effectively remove CV, MG, Cd(II), and Pb(II) from any wastewater.
Table 4 Removal of CV, MG, Cd(II) and Pb(II) in real samples.
Comparison CZ adsorbent with other adsorbents
According to the results, CZ adsorbent can be used as an adsorbent in the removal of CV, MG, Cd(II) and Pb(II). Table 5 shows some recent studies on various adsorbents in the removal of CV, MG, Cd(II) and Pb(II). CZ adsorbent showed the ability to remove CV, MG, Cd(II) and Pb(II) in a short time with high efficiency. Also, the proposed method has a smaller number of experiments than other methods in the literature, which results in less consumption of adsorbent and time. As a result, CZ adsorbent showed satisfactory performance in removing CV, MG, Cd(II) and Pb(II) from environmental water samples.
Table 5 Comparison of the CZ adsorbent with other adsorbents for removal CV, MG, Cd(II) and Pb(II).
[ad_2]
Originally Appeared Here